How do we use our causal loop diagrams (CLDs) to design interventions?
Here are a few examples...
My old horse, [[Shantie]], used to headshake. It is a disturbing condition with multiple potential causes. I created a CLD based on my experiences. I developed the diagram as I tried alternative interventions and learned from them.
I can only intervene where I have influence. I have highlighted in green the variables in the model that I can control. I have highlighted in yellow the variables I can influence to some extent.

Headshaking Intervention. [http://2.bp.blogspot.com/_jPevP6gWP4A/SxE62WmNRqI/AAAAAAAAAFc/WZ-g7NcoCxM/s1600/headshaking.jpg source]
Here is another example of a problem between two of my friends, Karen and Dave. Karen and Dave are partners but they had a problem they both helped to create. The symptom was Karen's weight. The causes were multiple.
Here I have highlighted in green the variables Karen influences. There are a different set of variables controlled by Dave. The best chance of Karen changing outcomes us to focus on the things within her control.
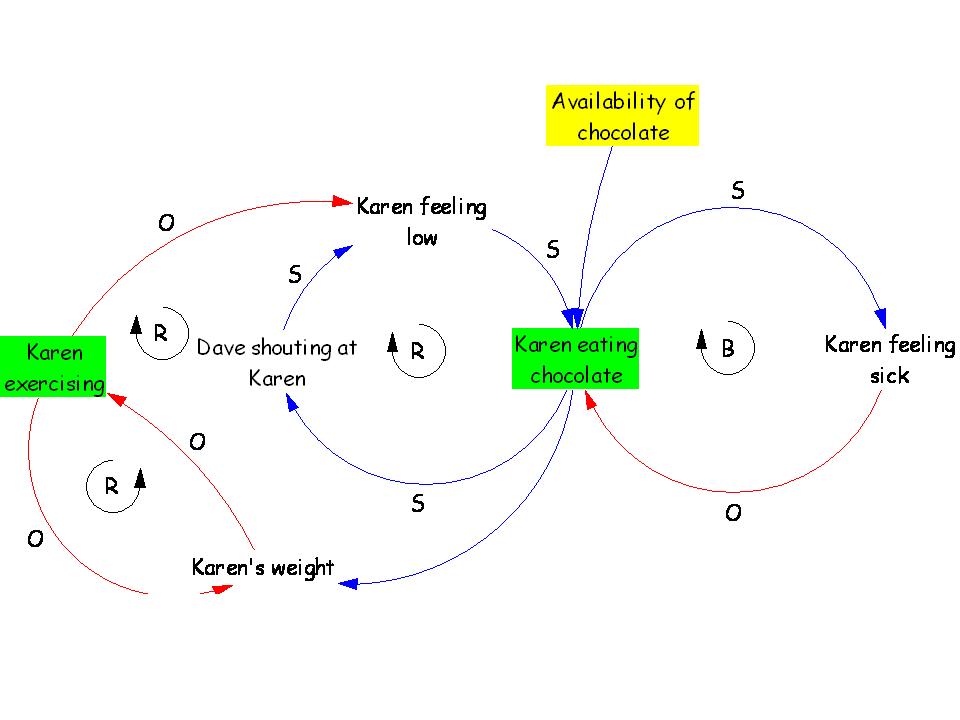
Karen and Dave CLD. [http://1.bp.blogspot.com/_jPevP6gWP4A/SxE7nXe8sjI/AAAAAAAAAGE/AL6tFk5Qlr8/s1600/Karen+and+Dave.jpg source]
We can use "uses tree" in Vensim to map the consequences of intervening on a particular variable.
We can also use "causes tree" in Vensim to create a hierarchical driver tree of the relationships driving an outcome variable. The best places to intervene are at the tips of the roots. See [[The 4Is]]. I3: Insight is about designing interventions. We need to remember that I4: Intervention is always an experiment and we must monitor the Impact (I1) if we are to learn.
- public document at doc.anagora.org/designing-interventions
- video call at meet.jit.si/designing-interventions