Systems thinking diagrams in PlantUML
[[Systems thinking]] diagrams in [[PlantUML]].
Specifically a stock and flow diagram.
There's nothing built-in.
Someone here and here has had a crack with Mermaid.
I think probably a deployment diagram looks the most hackable for this purpose in PlantUML.
Let's have a go.
Start with the bathtub example.
@startuml
left to right direction
cloud c1 as "..."
entity inflow
rectangle water as "water in tub"
entity outflow
cloud c2 as "..."

c1 -- inflow
inflow --> water
water -- outflow
outflow --> c2
@enduml

OK, that works OK. You get a cloud out-of-the-box, and using entity to represent an icon for flow is good enough for now. Could possibly use a sprite for that?
What about for something a bit more complex, with loops etc?
Let's try the coffee drinker example from [[Thinking in Systems]].
@startuml
rectangle stored as "stored energy in body"
entity expenditure as "energy expenditure"
cloud c1 as "..."
rectangle B {
entity mobilization as "metabolic mobilization of energy"
rectangle available as "energy available for work"
label discrepancy
label intake as "coffee intake"
}
label desired as "desired energy level"

stored -- mobilization
mobilization --> available
available -- expenditure
expenditure --> c1
available 0--> discrepancy
discrepancy 0--> intake
intake 0--> mobilization
desired 0--> discrepancy
@enduml
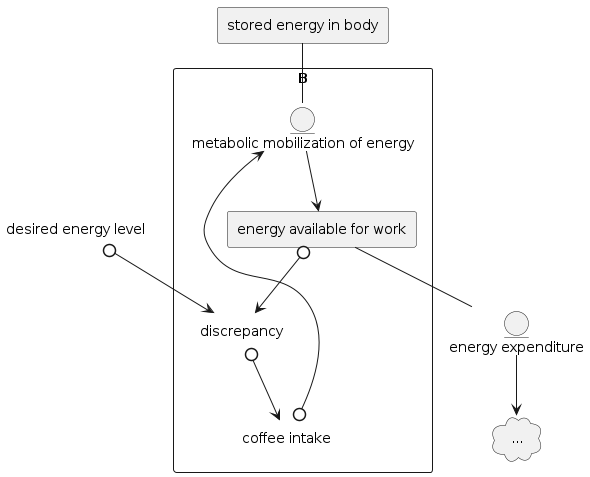
Struggles a bit here with the feedback loop. Hard to get it positioned in a useful place (I tried putting all the parts of the loop in a rectangle, but doesn't really work), and getting the 'B' inside the loop.
It's probably better to just sketch them, and then use something like the NetLogo System Dynamics Modeler to actually implement them and check their dynamics.
- public document at doc.anagora.org/systems-thinking-diagrams-in-plantuml
- video call at meet.jit.si/systems-thinking-diagrams-in-plantuml